Report review by Matt Gul and Selin Gul
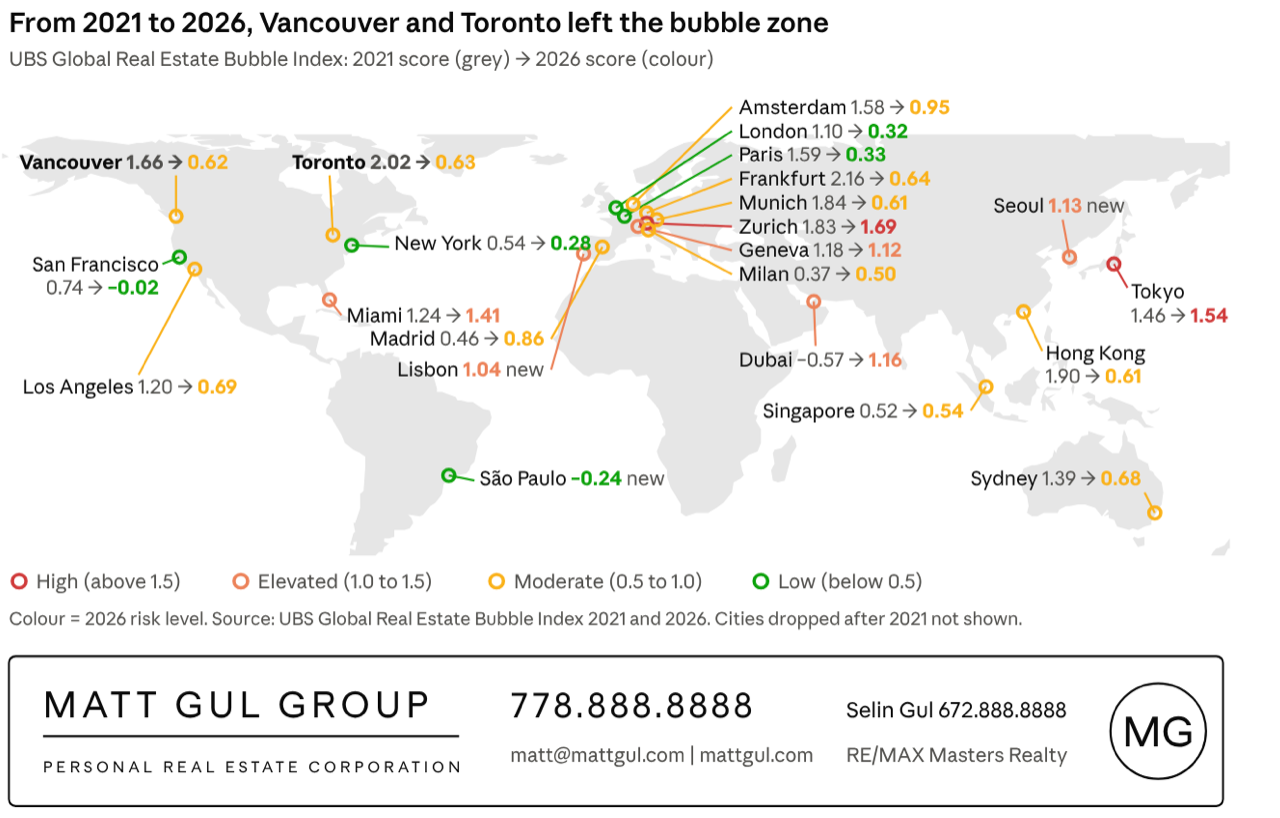
Vancouver scores 0.62 in the 2026 UBS Global Real Estate Bubble Index, placing it in the moderate-risk group and ranking 14th of 23 cities. Toronto is right beside it at 0.63. In 2021 and 2022, both cities sat in the bubble-risk zone. Five years later, they are among the weakest housing markets in the world.
I have reviewed the UBS Global Real Estate Bubble Index every year since 2021, and each time I write down what it means for our market here. This year UBS also released its Global Wealth Report 2026, so I read the two together. They point to the same thing. At the top end of the market, demand now comes more from wealth than from income.
That shift matters a great deal for West Vancouver, and it is a big part of why the headline numbers for Vancouver can mislead when it comes to the luxury segment.
Below I go through the global ranking, compare this year with 2021, look closely at Vancouver and Toronto, and add the market data that came out after UBS closed its numbers.
Only two cities in bubble territory
Only Zurich (1.69) and Tokyo (1.54) face high bubble risk in 2026. Miami, Dubai, Seoul, Geneva, and Lisbon are in the elevated group. Seoul and Lisbon join the study for the first time this year.
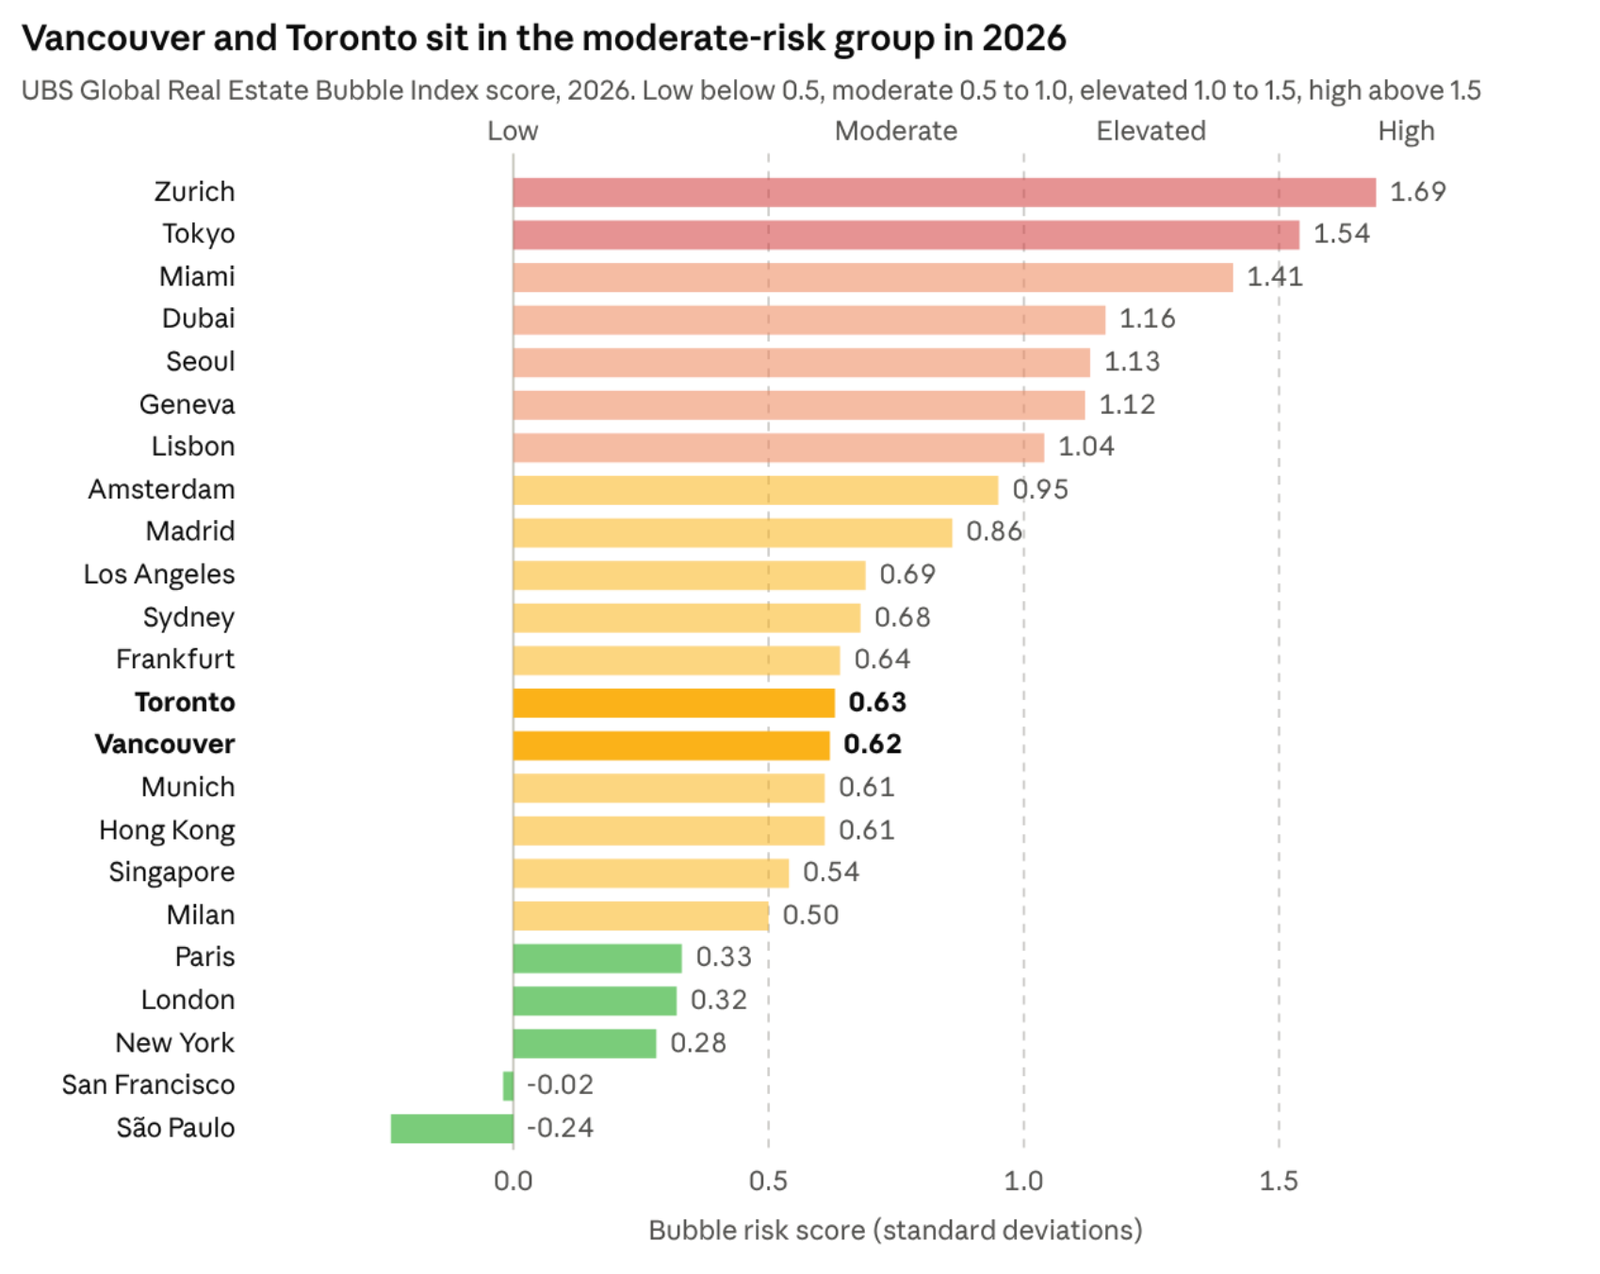
The average change is small this year. Across all 23 cities, real (inflation-adjusted) home prices rose only 0.5% over the past year, down from 1.4% in mid-2025. The spread between cities is getting wider, though. In the high and elevated cities, real prices are up nearly 30% over five years while incomes rose only about 8%. In the moderate and low-risk group, which includes Vancouver, real prices fell by nearly 10%.
UBS explains part of this with wealth. Strong stock markets and new AI-related fortunes let affluent buyers put down larger deposits or pay cash, so prime neighbourhoods are pulling away from the rest of their cities. UBS also expects stable, safe-haven cities with trophy homes to gain from today's global uncertainty.
How much has changed since 2021
In 2021, Toronto ranked 2nd in the world (2.02) and Vancouver 6th (1.66), both deep in bubble territory. In 2026, both score about 0.6. Only Frankfurt and Dubai moved further.
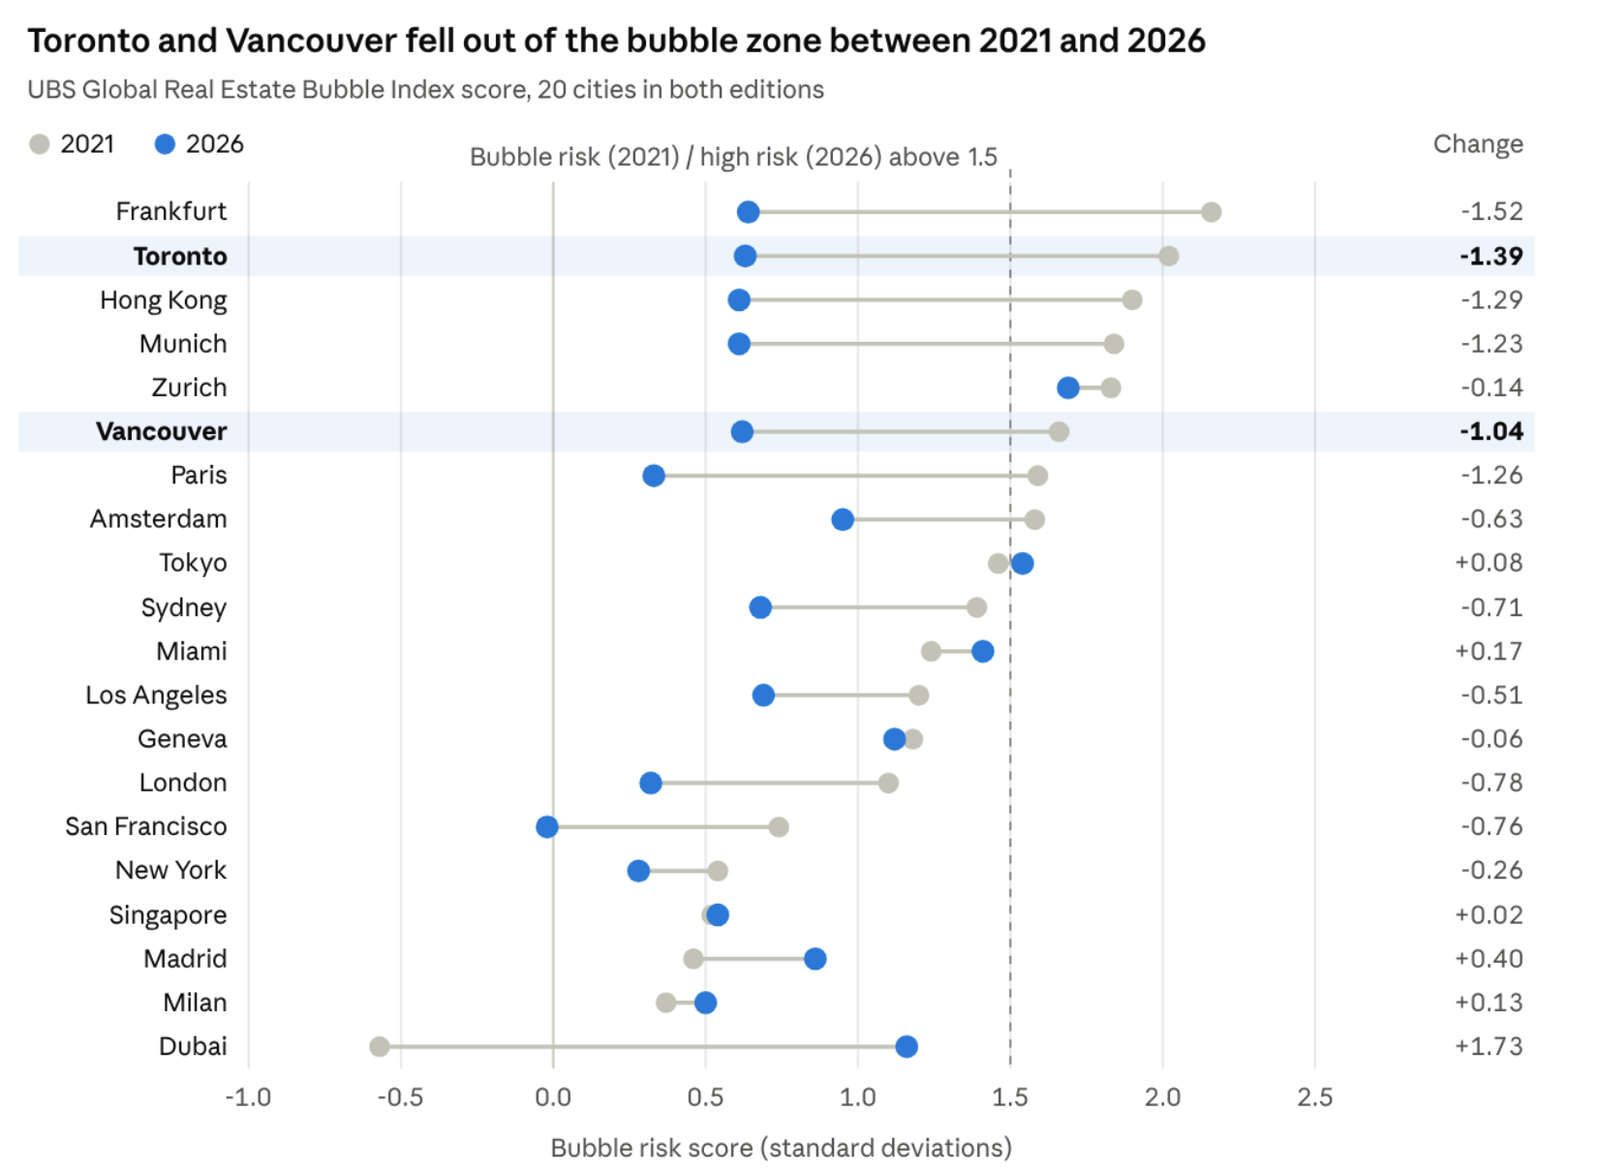
I picked 2021 for this comparison because it was the last edition before interest rates started to climb. The market was at its most stretched then, so it gives the clearest before-and-after picture.
The cities that led in 2021 cooled the most. Frankfurt, Toronto, Hong Kong, Munich, Paris, and Vancouver all dropped by more than a full point. A few went the other way. Dubai jumped from undervalued (-0.57) to elevated (1.16), and Miami, Tokyo, and Madrid also rose. Zurich barely moved at all. Very low Swiss mortgage rates kept it near the top.
Vancouver has moved from bubble risk to a buyer's market
Vancouver's real home prices fell 9.7% over the past year and are now about 20% below their 2022 peak, after inflation.
2021 and 2022: bubble risk. In 2021 Vancouver scored 1.66 and ranked 6th of 25 cities, after low rates, pandemic upsizing, and fast debt growth pushed prices far ahead of incomes.
2023: out of the bubble zone, as mortgage rates roughly tripled and real prices fell.
2025: moderate risk.
2026: moderate risk, with a score of 0.62, 14th of 23 cities.
UBS blames stringent mortgage stress tests, extra taxes, and the foreign buyer restrictions. Together they have held back demand even though the Bank of Canada cut rates. Listings are well above their long-term average, and sales fell to a 25-year low.
Rents are softer as well. Real rents fell 5.0% over the year, and with more rental supply coming on, landlords are now competing for good tenants. For the owners we look after through RentYVR, that means pricing carefully and keeping units in top shape.
The owning versus renting numbers are worth a closer look. In UBS's user-cost study, Vancouver has the second-largest gap in the world between the full cost of owning and the cost of renting, behind only Hong Kong. On paper, that means buying only pays off if prices rise. Over ten years, Vancouver's real prices grew only 0.3% a year, while rents grew 1.0% a year.
Toronto has seen the sharpest correction
Toronto was the strongest market in the study from 2014 to 2022, when real prices doubled. In 2021 it ranked 2nd in the world with a score of 2.02. Since 2022 it has been the weakest. Real prices are now nearly 30% below the peak and fell 10.7% in the past year alone.
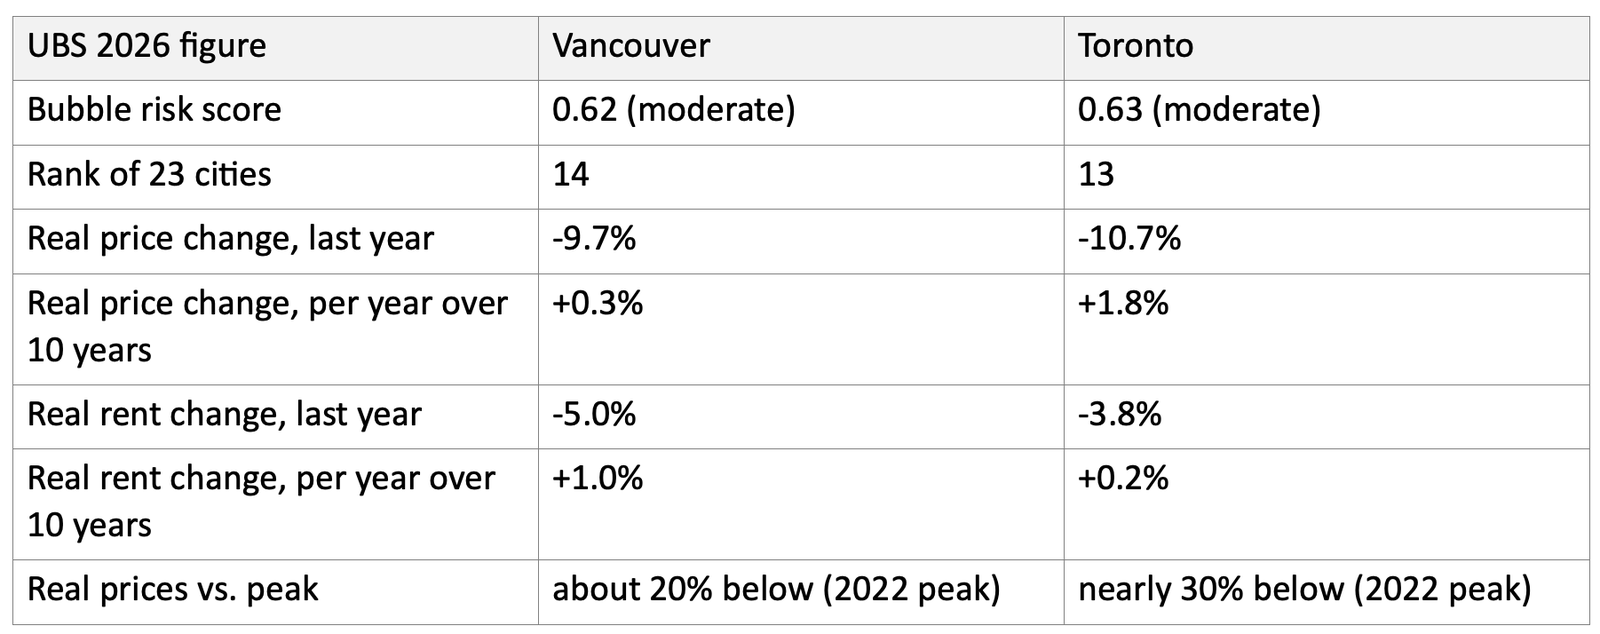
On paper the two cities now look almost the same. The real difference is supply. Toronto built far more condos in the last cycle and is still working through that inventory. On the North Shore, geography limits how many detached and waterfront homes can ever be built, which should support values over the long term.
Prices kept falling after UBS closed its numbers
Since the end of June, the Greater Vancouver benchmark price has dropped another 1.6%, from $1,099,100 to $1,081,900. The UBS numbers do not include this.
UBS published the 2026 index on 22 September 2026, but its price data only runs to the end of June. Therefore, the report is about three months behind the market. Here is what the Greater Vancouver REALTORS (GVR) MLS Home Price Index shows since then:
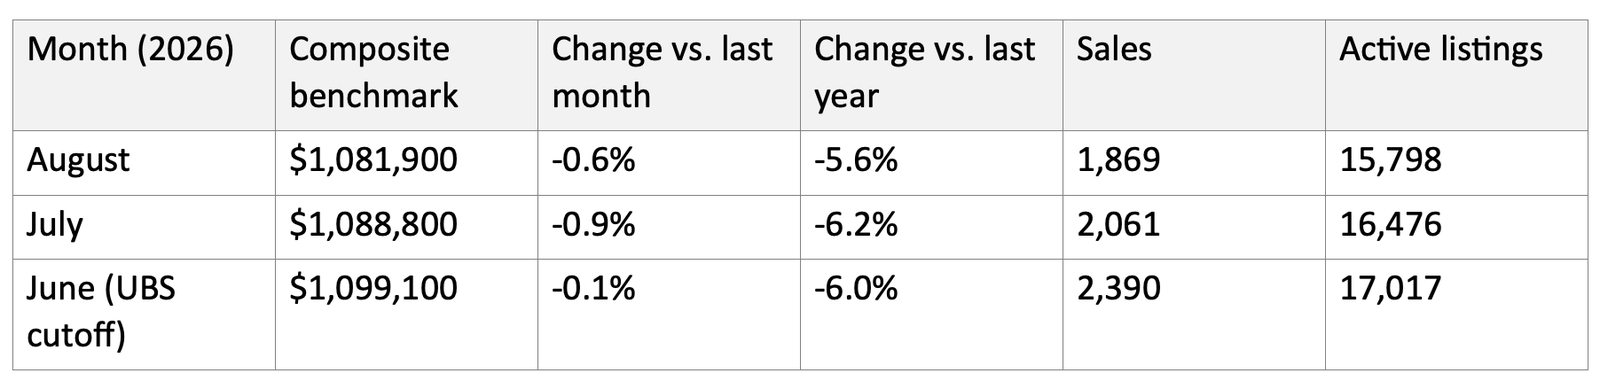
On the North Shore, the August GVR benchmarks look like this:
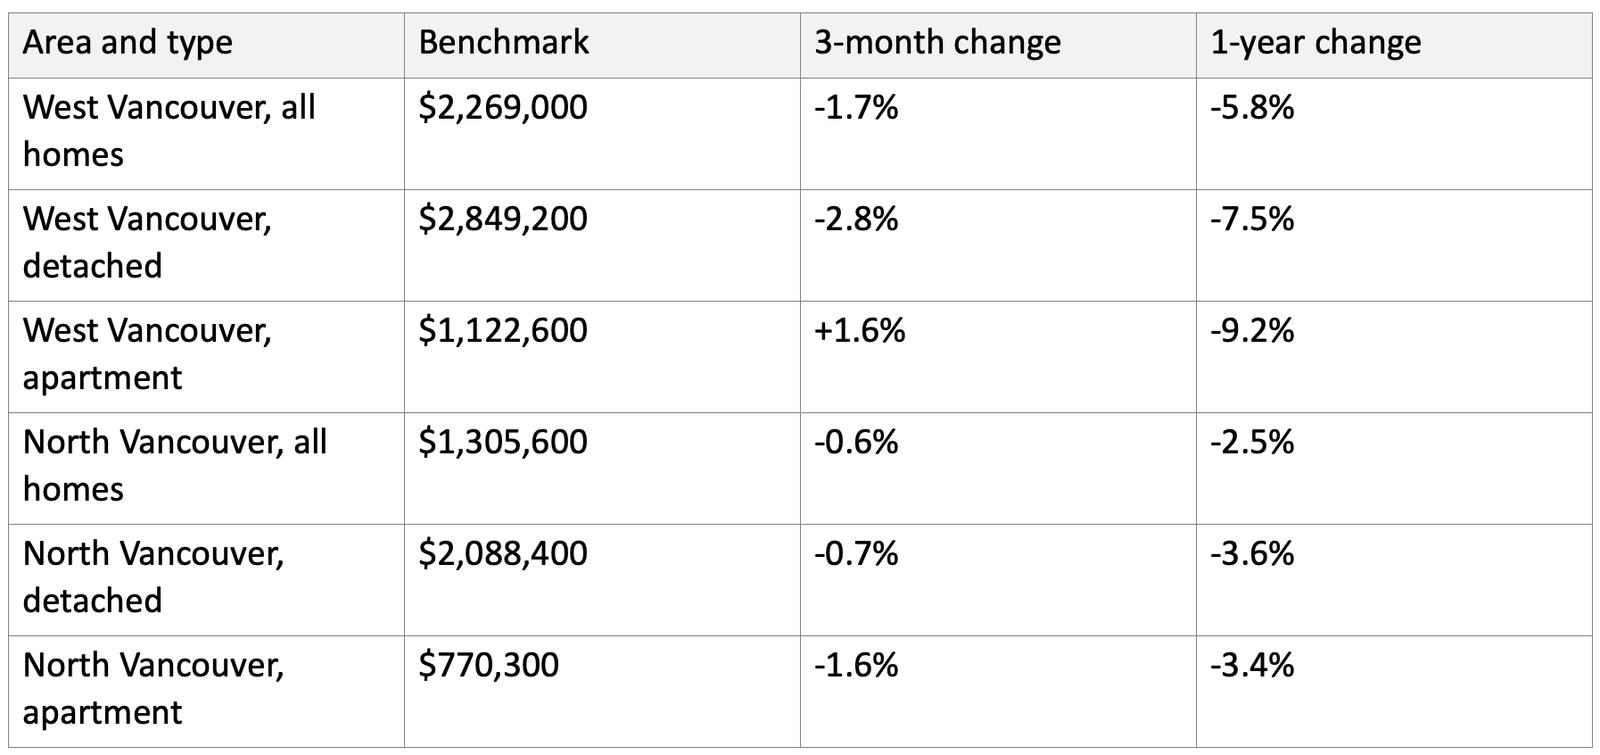
West Vancouver detached homes are still adjusting and fell a bit faster than the region over the past year. North Vancouver has held up best. West Vancouver apartments have risen for three months in a row.
Sales are still weak. August sales were 20.7% below the 10-year average, and active listings were 26.2% above it. The sales-to-active ratio was 12.3%, and only 9.6% for detached homes, which is the range where GVR says prices face downward pressure.
The Bank of Canada kept its rate at 2.25% on September 2nd, with the next decision on October 28th, and five-year fixed mortgages are around 4.1%.
A policy-driven correction, not a crash
Vancouver is not a free housing market. Since 2016, governments have added one tax or rule after another to cool demand. In my view, the price decline we see today is largely policy-driven, not a crash caused by weak fundamentals. UBS says the same thing in its Vancouver profile: "stringent mortgage stress tests, additional taxes, and restrictions on foreign buyers have dampened housing demand."
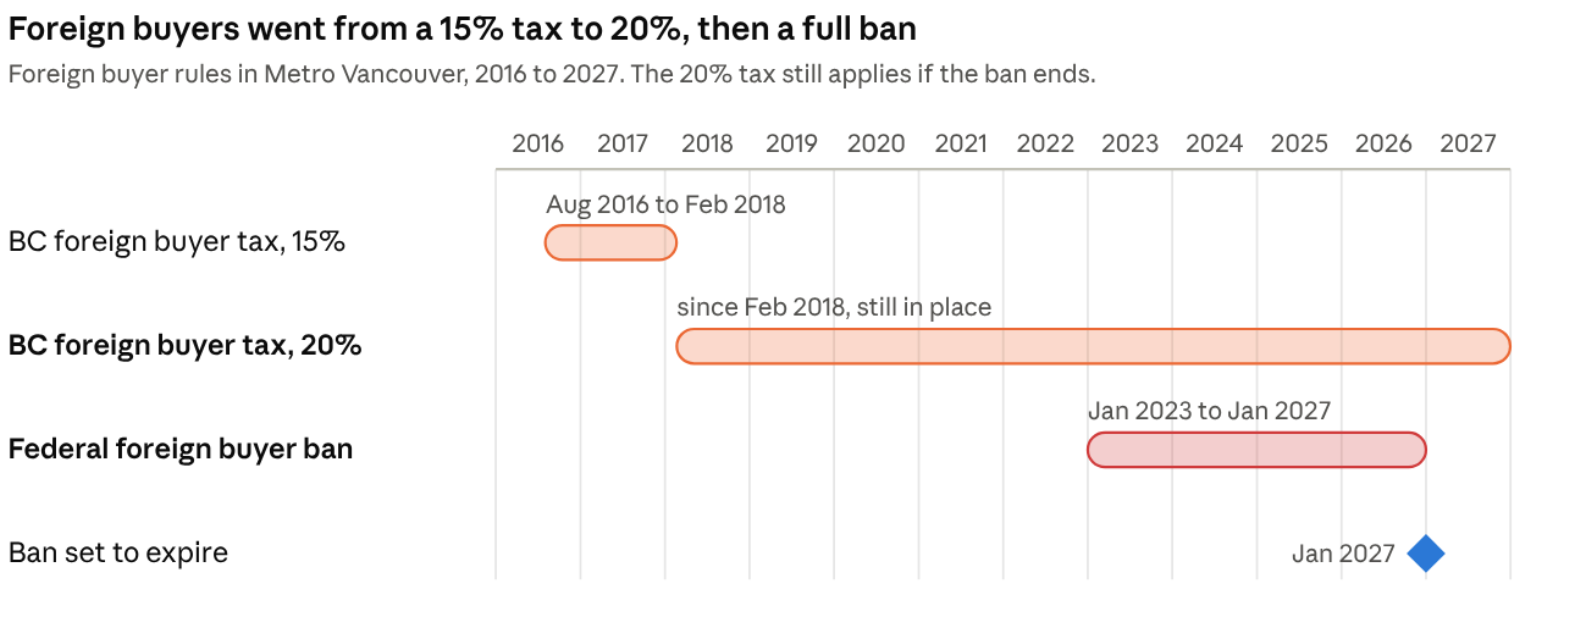
The foreign buyer rules show how the pressure built up step by step. The tax started at 15% in August 2016, went up to 20% in February 2018, and a full federal ban was added on top in January 2023
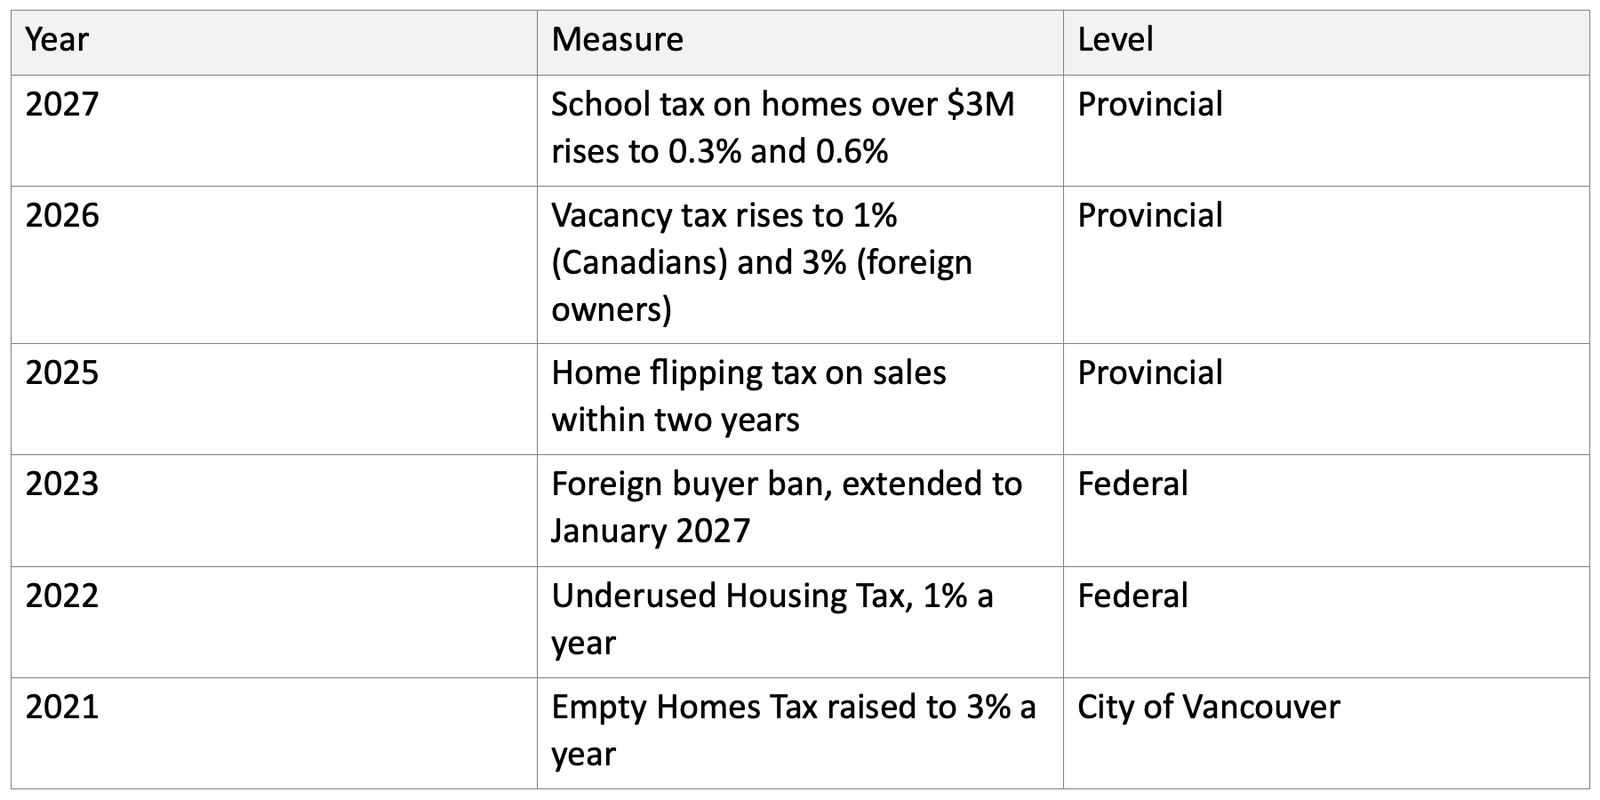
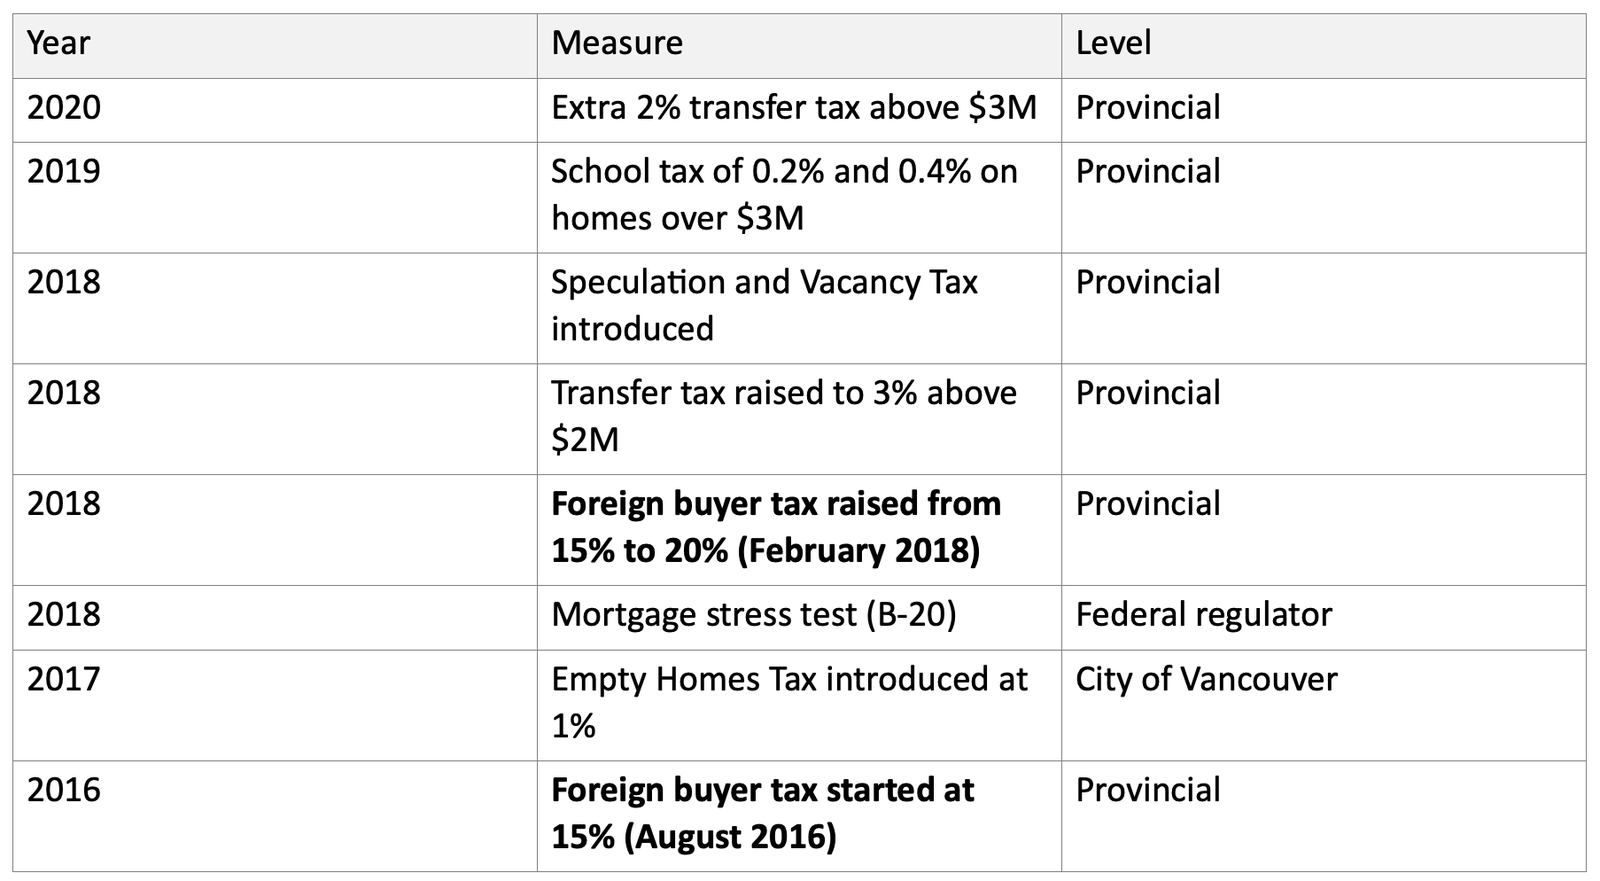
For a buyer in West Vancouver, the cost adds up quickly. On a $5 million home, the property transfer tax alone is about $168,000. The additional school tax is about $6,000 a year today. A foreign buyer, if allowed to buy at all, would pay another $1 million in foreign buyer tax.
I do not call this a crash. In a crash, owners cannot pay and forced sales drive prices down. That is not what I see. The Bank of Canada rate is on hold at 2.25%, and the economy grew 3.3% in the second quarter. What I see instead are buyers who have been priced out by policy and buyers who are waiting on the sidelines. Higher mortgage costs and slower population growth play a part as well.
The date to watch is 1 January 2027, when the federal foreign buyer ban is set to expire. As of September 2026, Ottawa had not announced another extension. The 20% BC foreign buyer tax would still apply, so the effect may be modest at first. For the luxury segment, where international buyers have always been an important part of demand, it could still mark a turning point.
What the Global Wealth Report 2026 adds
Global personal wealth grew 10.8% in 2025 (in US dollars), more than twice the pace of 2023 and 2024. The world added nearly one million new US dollar millionaires, about 2,680 every day, and every one of the 56 markets UBS tracks ended the year with more millionaires than it started with.
UBS now counts about 57.5 million US dollar millionaires in the world, 44.8% of them in North America. Around 7 million people hold between USD 5 million and USD 100 million.
The gains were not shared evenly. Average wealth rose sharply, but median wealth fell in most markets, so most of the growth went to people who already owned assets. Housing plays a big role here. For people worth USD 1 to 5 million, their own home is usually their largest asset, and UBS notes that rising home values have made many people millionaires without any change in their income.
Canada ranks 13th in the world for average wealth per adult (USD 399,886) and 7th for median wealth (USD 147,811). The higher median rank shows that wealth in Canada is spread more widely than in many richer countries. Financial assets make up 66.2% of Canadian gross wealth, and debt equals 18.2%, one of the higher debt shares in the report.
Read side by side, the two reports say the same thing. As homes become harder to afford on income alone, accumulated wealth becomes the main driver of demand, and prime areas outperform. That matches what I see in my own practice. Many of our luxury buyers in West Vancouver buy with equity from another property, the sale of a business, or an investment portfolio, and they are far less sensitive to mortgage rates than a first-time buyer. This is why the headline numbers for Vancouver do not tell the full story for a waterfront home in Dundarave or a home in the British Properties.
What this means for you
The 2026 index tells us Vancouver is no longer in a bubble. It is a corrected market, and buyers have more choice than they have had in years.
If you are buying, you have more selection and more room to negotiate than at any point in recent memory, with listings high and sales at a 25-year low. If you are selling, price for today's market, not the 2022 market. Homes that are priced well and presented well still sell. If you are investing, keep in mind that rents are softer and owning costs more than renting. Returns will come from buying well and holding for the long term, not from quick gains.
The UBS index does not predict when a market will turn. It measures risk. Right now, the risk in Vancouver is moderate and falling, while the wealth behind our top-end buyers keeps growing.
A resilient market
Think about everything this market has absorbed in ten years: a 20% foreign buyer tax, a full foreign buyer ban, three different vacancy taxes, higher transfer tax on more expensive homes, an extra school tax on homes, a stress test, and a flipping tax. Add the fastest rate increases in a generation. In my experience, few major global markets have faced this many demand-side measures at the same time.
And yet, Vancouver prices are only about 20% below their 2022 peak after inflation. A West Vancouver home still has a benchmark price of $2,269,000. People still want to live between the mountains and the ocean, in a safe country, and the land to build more waterfront and view homes simply does not exist.
If you would like to talk about what these numbers mean for your home or your next purchase, please call me at 778.888.8888 or Selin Gul at 672.888.8888, or email matt@mattgul.com / selin@mattgul.com
Matt Gul Group, RE/MAX Masters Realty
This post summarizes public UBS research for general information. It is not financial or investment advice.
Previous editions
Sources
Market data after the report: GVR August 2026 stats package (released 2 September 2026), GVR June and July 2026 summaries, UBS 2026 media release (22 September 2026), Bank of Canada, 2 September 2026, MoneySense on mortgage rates, Statistics Canada CPI via Retail Insider, CP24 on Toronto.