Canadian Real Estate
The Last Time Canadian Household Debt Grew This Slow Was 1983
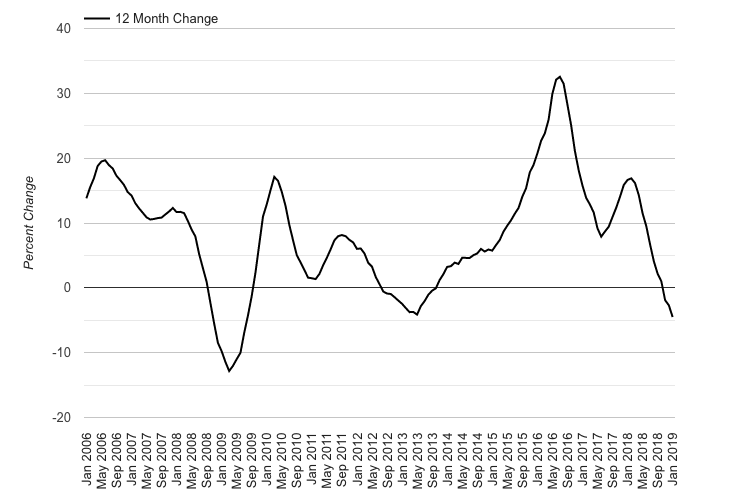
The household debt in Canada is at a current new record high, yet the growth rate is decelerating. The balance of outstanding debt reached $2.16 trillion in December, up 3.1% from the year before. This pace of growth was 39% lower than the year before which is the slowest since June 1983. Yes, the last time Canadians borrowed at a slower pace was over three and a half decades ago.
Greater Vancouver Home Prices Are Down Over 6% From Peak
The price of a typical home in Greater Vancouver is dropping. REBGV reported a benchmark a composite home costs $1,019,600 in January, which is down 1.23% from the month before. This represents a 4.5% decrease year-over-year, or a total of $36,900 lower. In the City, Vancouver West fell to $1,262,400, down 6.9% from last year. Vancouver East fell to $1,025,200, down 6.3% from last year. Yes, the price drops are real and the trend appears to be getting worse in the near term.
Currently, the annual pace of growth is getting larger, and prices are down significantly from peak. The 4.5% decline in January is larger than the month before, and it is also the largest we’ve seen since July 2009. Prices peaked in May 2018, and are down 6.85% across the region which is a loss or savings of $74,400. People tend to think this isn’t that big, but it’s almost a year of pre-tax income for a typical Vancouver household. Working a year or two less to pay off a house is kind of a big deal.
Greater Vancouver Real Estate Inventory Rises Over 55%
Time for an exit? Brand new listings for Greater Vancouver real estate made a sudden surge last month. REBGV reported a sum of 4,848 new listings in January, up 244.6% from the month before. This represents a 27.7% increase from the same month last year. Once again, the monthly increase is expected, the annual isn’t so much.
The rise in new listings helped to push the total number of inventory higher. REBGV reported 10,808 active listings in January, which is up 5.2% from December. This represents a 55.6% increase compared to last year, and the highest January level since 2015.
Higher inventory and lower sales dropped the sales to active listings ratio (SALR). The SALR dropped to 10.2, a drop of 60.91% from last year. The market is considered a “seller’s market” when the ratio is above 20, and prices are expected to rise. The market is considered a “buyer’s market” when the ratio drops below 12, and prices are expected to drop. Between 12 and 20 is when the market is “balanced,” and prices are just right. We are currently in a buyer’s market, so pressure is on for prices to move lower.
The market saw a rise in inventory, and falling sales which produced lower prices. Inventory for January is the highest since 2015, putting the market right back before it’s epic run. Sales for January, have fallen to levels we haven’t seen since 2009. That might mean further problems for prices, as indicated by the SALR.
Also if you are thinking on buying or selling your properties, please contact Matt Gul, who is a top luxury real estate agent situated in West Vancouver, who can help you with all of your needs. To contact Matt Gul please call him at 778.888.8888 or email him at matt@mattgul.com
Source: https://www.citynews1130.com/2019/01/02/condo-owners-gains-bc-assessment/
Summarized by: Onur Gul